📡The network, live
Real UK LoRa-APRS data, right now — no login needed. The board updates automatically every ~10 minutes and shows the last 24 hours: active iGates, packets heard, unique stations, furthest direct DX, peak packets per hour, a coverage-density map (~1 km hex cells, aggregate only — no exact locations), and an anonymised gate leaderboard. Fully PII-free by design: the leaderboard shows "Gate #1…#5" with no callsigns or names — the per-gate detail is the members-only product.
See the live UK LoRa-APRS network — anonymised, last 24 hours, no login.
📡 View the live board ↗Open full screen ↗ · Fixed 24 h window · no date picker · auto-refreshes
📻About
I'm Shaun, a UK amateur radio operator based in England and a member of HADARS — the Halifax & District Amateur Radio Society (club callsign G2UG). My main interest right now is LoRa-APRS — long-range, low-power packet beacons on 439.9125 MHz — and the RF-performance side of running iGates: how far signals actually reach, how clean they are, and building the tooling to measure it.
🛰️LoRa-APRS
ESP32 iGates receiving and relaying APRS beacons over LoRa, feeding a self-hosted analytics stack.
📈RF analytics
Coverage, SNR/RSSI, DX records and digipeat paths — lora-aprs.live-style insight, on my own kit.
🔧Self-hosted
Node-RED · InfluxDB · Grafana on a Proxmox cluster. No cloud lock-in, multi-tenant by design.
🌐The LoRa-APRS monitoring network
Run a LoRa-APRS iGate? Send me its syslog and I'll give you a free, live Grafana dashboard for your own gate — coverage map, link quality, packet rates, DX and telemetry — plus automatic outage alerts. Once you've pointed your syslog at us, adding another gate or SSID needs no further setup — it just appears — and you only ever see your own data.
Getting on in three steps
- Register your callsign. Fill in the onboarding form with your
CALLSIGN-SSIDand email. You'll get a one-time verification code back. - Point your gate at us & beacon the code. Set your iGate's syslog output to
m7xsj.co.ukport1516(UDP) and drop the code into your beacon comment so I can confirm the gate is really yours. - Get your dashboard. Once your beacon is detected you're emailed a Grafana invite. Set a password and your dashboard is live — covering all your SSIDs, and nobody else's.
🔔Alerts — opt-in & self-service
The network watches your gates and emails you when something changes — but only what you ask for. Every alert is opt-in (default: off): you choose which ones you get and set your own thresholds from a secure link that arrives in your emails. Alerts fire on state changes only — no spam — and auto-resolve when things recover.
Offline — and it tells you why
If your gate goes quiet past your threshold you get a heads-up that distinguishes radio down (nobody else hears you either — power, antenna or radio) from uplink down (another gate still hears you on RF, so your radio's alive but the internet dropped). The email even names the gate that still hears you, how recently, and how strong.
Antenna / feedline trouble — caught by the mesh
The failure that hides in plain sight: your gate is still online and still decoding, but your antenna or feedline has quietly degraded (a loose connector, water ingress, a knocked antenna). It passes every "is it up?" check, so it's normally invisible — except the network catches it by cross-checking against the other gates. Each gate-to-gate RF link has its own baseline, so when several gates that normally hear you cleanly all start hearing you weaker — or lose your direct signal — that agreement points at your antenna, not the weather. The alert names exactly which links degraded and by how much. (A lone gate with no neighbours falls back to watching its own reception volume.)
Back-online recovery
When packets start flowing again you get a “back online” note — so you know it cleared without having to go and check.
Low battery
For solar / battery gates that report their own voltage, an optional alert fires before it browns out. Mains-powered gates report no battery, so it simply never triggers.
You're in control
Pick your alerts and thresholds yourself on a token-protected preferences page linked in every email. The network only ever emails your verified address — settings can't be pointed at anyone else. And if an outage is on my side, you won't be blamed or spammed for it.
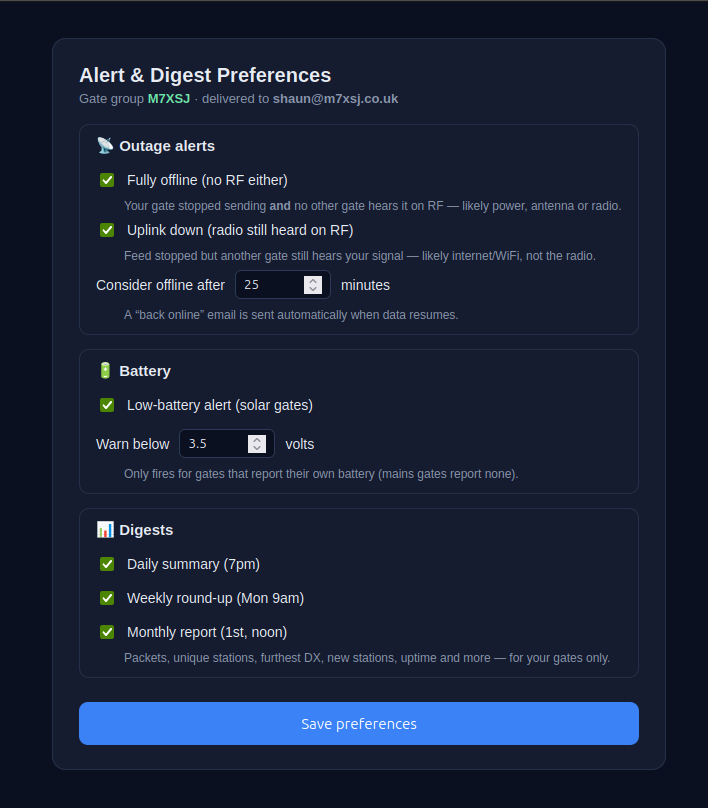
📰Digests — your network, summarised
Opt-in email summaries of how your gates are doing, on the cadence you choose. Off by default — switch on the ones you want from the same preferences page as your alerts, and they only ever cover your own gates.
📅Daily
A quick once-a-day recap, sent each evening (7pm UK).
🗓️Weekly
The week in review, every Monday morning (9am UK).
📆Monthly
A full-month report on the 1st (noon UK).
👥Clubs — share a club-wide dashboard
Run gates with your radio club? Pool them into one club dashboard — a combined view of every member's gate, with club-wide totals and a per-gate leaderboard. It comes in two flavours: a private members view (log in to see the full board) and a public link you can share anywhere — no login needed.
📊Club totals & KPIs
Total packets, unique stations heard, club-wide furthest DX and how many gates are active — across the whole club at a glance.
🏆Gate leaderboard
Every member gate ranked by packets, with stations heard, best DX, average SNR and last-heard — a friendly bit of rivalry over who's hearing the most.
🌐Public share link
A clean read-only URL for your club website or socials — live club totals and the gate leaderboard, no login needed. Exact gate and station locations stay on the members' map, so nothing private goes public.
✅Opt-in & fair
Members choose to join and share their stats. The figures count direct RF only (digipeated/relayed traffic excluded), so the leaderboard reflects what each gate genuinely heard over the air.
🔗Invite by magic link
The club owner gets a single invite link to share with members. Click it, confirm your verified gateway, and you're in — your gate joins the club board within minutes.
💬Members' chat
A built-in shoutbox on the private club board — a quick place for members to compare notes or flag a gate that's acting up. Members-only and moderated; it never appears on the public link.
🧩Firmware compatibility
The network currently understands the syslog output of one firmware — the excellent and very widely used CA2RXU LoRa-APRS iGate by Ricardo Guzman (CA2RXU). If you run that firmware, you're good to go.
✅Supported today
CA2RXU LoRa_APRS_iGate — the popular ESP32 firmware for Heltec / LilyGO / RAK boards. Parsing is built around its syslog format. Flash it via the web flasher. Huge thanks to Ricardo (CA2RXU) for the firmware this all rides on.
🤝Run something else?
If your iGate runs different firmware or emits a different syslog format, I'd love to support it — send me a sample and I'll add a parser. Email shaun@m7xsj.co.uk or say hi at the weekly HADARS club meetup.
Put your iGate on the map
It takes about five minutes and costs nothing. Register, point your syslog at the network, and watch your coverage build up in real time.