⚙️How it works
Your ESP32 LoRa-APRS iGate already emits syslog. Repoint that one setting at the network and everything downstream is automatic — there's no per-operator configuration on my side. All a gate needs is its normal internet connection to reach the network, and you'll be alerted if that link ever drops.
Self-provisioning & ownership-checked
A new gate that starts sending syslog is recognised by its callsign and immediately gets its own private data store. Before you get a login, though, you prove the gate is yours: you beacon a one-time code I issue at registration, and the network confirms it arrived through your gate. That keeps the spoofable nature of plain UDP from handing anyone else's data out.
📊What you get
A Grafana dashboard per gate, grouped under one login for your callsign. Edit it, rearrange it, even delete a panel — it's yours. (Delete the whole thing and a fresh copy self-heals within ~10 minutes.)
🗺️Coverage maps
Where you're being heard — direct contacts (green) shown apart from digipeater relays, with the full path drawn in two colours: the gateway→relay hop in orange and the relay→origin hop in purple. Plus reception lines, latest distance & RSSI per station and recency trails.
🎛️Direct-RF toggle
One RF Mode switch flips the whole dashboard between all traffic and direct RF only — instantly hiding anything received via a digipeater so you see just the stations you truly hear over the air, with honest direct-only DX and counts.
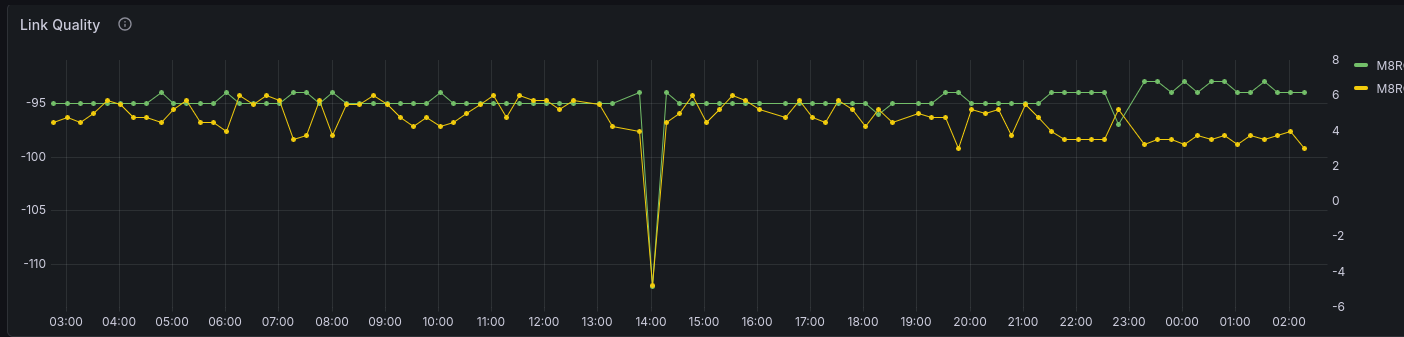
📶Signal & RF
Link quality, SNR-vs-distance, CRC rate and per-station averages — sorted weakest-first. RSSI/SNR and DX are always attributed to direct contacts only, never to a relay.
📡Activity
Packet rate, station activity, packet categories and your furthest-DX records, direct vs via-digi.
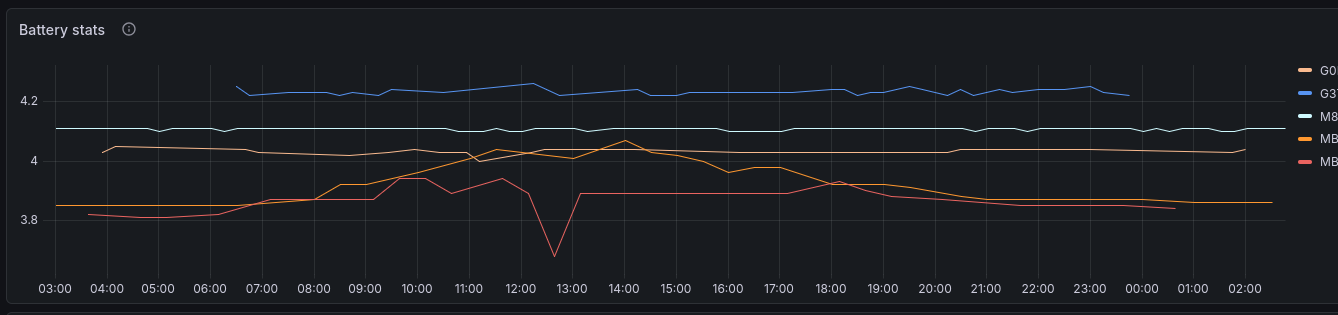
🔋Telemetry
Battery and device telemetry from heard stations, plus the raw recent-packets log.
🔒Isolation
You see only your own gates. Folders are locked per operator — no cross-tenant leakage.
➕Auto-expanding
Add another SSID later and its dashboard appears automatically — no re-registration needed.
🛰️Tracker dashboards
Got a mobile beacon on your callsign — a van, car or bike (e.g. -3, -9)? Trackers don't run syslog, so they can't join on their own — but the moment any iGate on the network hears one, it automatically gets its own station-centric dashboard: its track on the map with speed and direction-of-travel arrows, which gates heard it, best SNR per gate and reception over time — stitched together from every gate that hears it, not just your own. Click any beacon on the trail to fan reception lines out to every gate that caught it, with a per-gate signal table, the full relay path, and an ⛰️ terrain cross-section of the RF path between the tracker and each gate.
If you want to customise your tracker dashboard and keep those changes, use Grafana's Save as Copy (Dashboard settings → Save as Copy) to create your own separate copy under a new name. The auto-sync only manages the original
track-<call> board; a saved copy is yours and is never overwritten.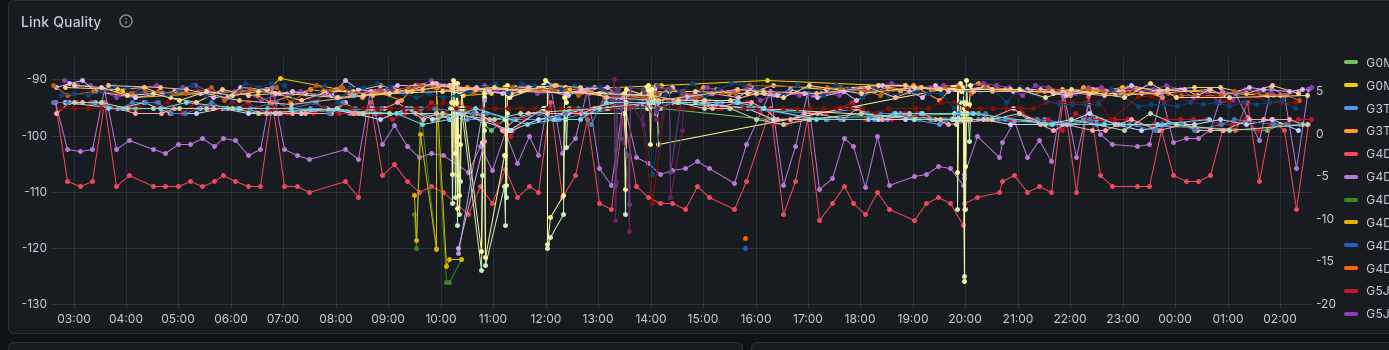
🔔Alerting
Alerts are per-operator and opt-in — everything is off until you switch it on. You choose which alerts you want and set your own thresholds on a secure, token-gated preferences page that's linked in every email the network sends you. State-change only (no spam), self-resolving, and only ever sent to your verified address.
Offline — radio-down vs uplink-down
When your feed goes silent past your threshold, the network checks whether another gate still hears you on RF. If not, it's a true radio/power/antenna outage. If yes, your radio is fine and your internet/uplink is the problem — and the email names the witness gate, how recently it heard you and at what signal.
Antenna / feedline — mesh cross-corroboration
Your gate is still online and still decoding, but its antenna or feedline has degraded (loose connector, water ingress, a knocked antenna). A packet count alone can miss this — a gate can hear the same number of stations while every signal sinks to the noise floor — so the network compares each gate-to-gate RF link against its own baseline. When a majority of the links touching your gate degrade together (others hearing you weaker, or losing your direct path), the common cause is your antenna rather than one far station or the band; a single bad link instead points at that one path. The email lists each affected link with its before/after signal. Gates with no mesh neighbours fall back to a reception-volume check.
Recovery
A “back online” email when packets resume, if you opted into either offline alert.
Low battery
Your gate's own reported voltage under your floor — useful for solar / off-grid sites. No battery sensor = never fires.
You're in control
Thresholds and on/off switches are yours, via the prefs link in your emails. If the whole network goes dark at once that's flagged as my infrastructure — you won't get a false "your gate is down" in that case.
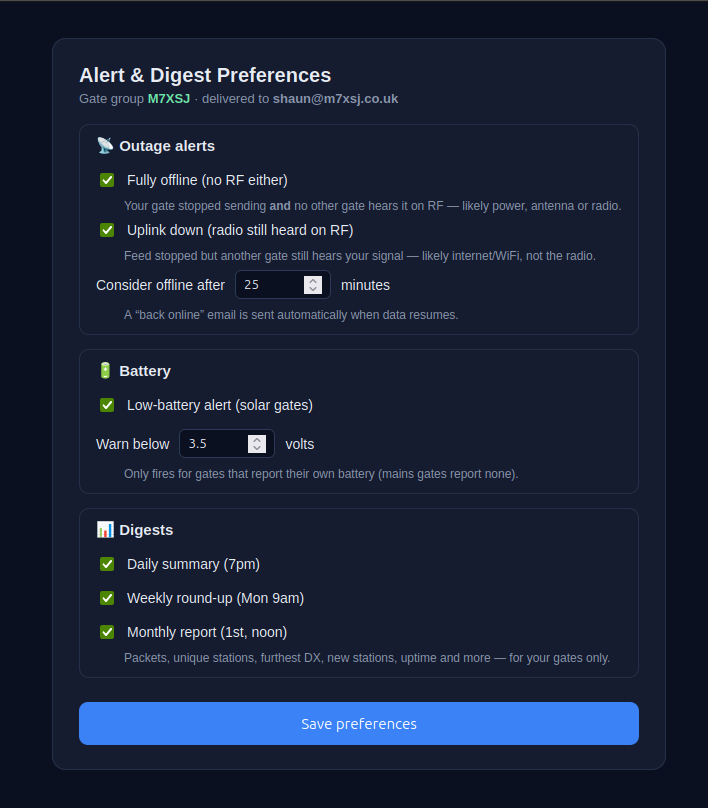
📰Digests
Opt-in email summaries of your gates, on the cadence you choose — off by default, switched on from the same preferences page as your alerts. Like everything else, they cover your gates only.
📅Daily
A once-a-day recap each evening (7pm UK).
🗓️Weekly
The week in review, every Monday (9am UK).
📆Monthly
A full-month report on the 1st (noon UK).
Note: brief sub-10-minute reboots aren't flagged as outages — a gate beacons only every ~10 minutes, so short silences can't be told apart from quiet RF; the sparkline shows the dips honestly instead.
🚀Join the network
- Register. n8n.m7xsj.co.uk/form/aprs — enter
CALLSIGN-SSID, name and email. You get a verification code (e.g.LORA123456). - Repoint syslog. On your iGate, set syslog server to
m7xsj.co.uk, port1516, protocol UDP. - Beacon the code. Put the code in your beacon comment and let it transmit. The network detects it through your gate (up to a ~90 min window — plenty of time to finish setup).
- Accept your invite. You're emailed a Grafana invite — set a password and your dashboard(s) are live. You can remove the code from your comment afterwards.
Prefer to run your own?
The whole stack — syslog parsing in Node-RED, InfluxDB storage and the Grafana dashboard — is documented as a step-by-step build guide.
🛠️ Build your own LoRa-APRS dashboard